Category Archives: Precious Metals

Commodities Markets: History of Gold Prices

Why should investors want to know about the history of gold prices?

As a financial investor buying and selling commodities, it is important to understand the market’s underlying trends. Knowing about the history of gold prices will also help investors make better financial decisions — not only in commodities but other markets, as well.

It is important to know more about the history of your business and the industry in which it operates. Over time, these types of practices can help to shed light on how you should invest and when certain mistakes can be avoided.

Gold’s history as a safe-haven asset

In gold, you will know why the prices change the way they changed, which is why investors should consider buying some of the best gold coin inventory. You also know about the high and the low season.

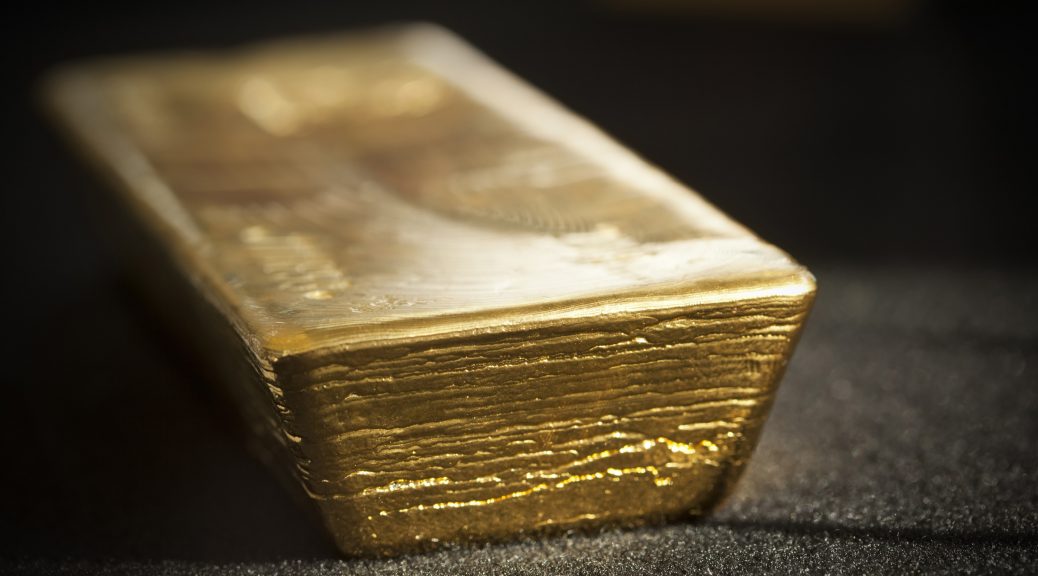
Gold is seen as the most precious metal among the others. Its value is mostly higher than the others. Today, gold is still used as a reliable way to store wealth and this will continue to be the case because of the changing values of fiat and paper currencies.

Gold prices can change but they have historically remained at a reasonable level of value. Therefore, gold is still the best measure of wealth for investors.

History of financial markets

This is a continuation of the traditional norms, as kings and queens have always stored their wealth in the form of gold. Many decades ago, gold was used as money on an everyday basis.

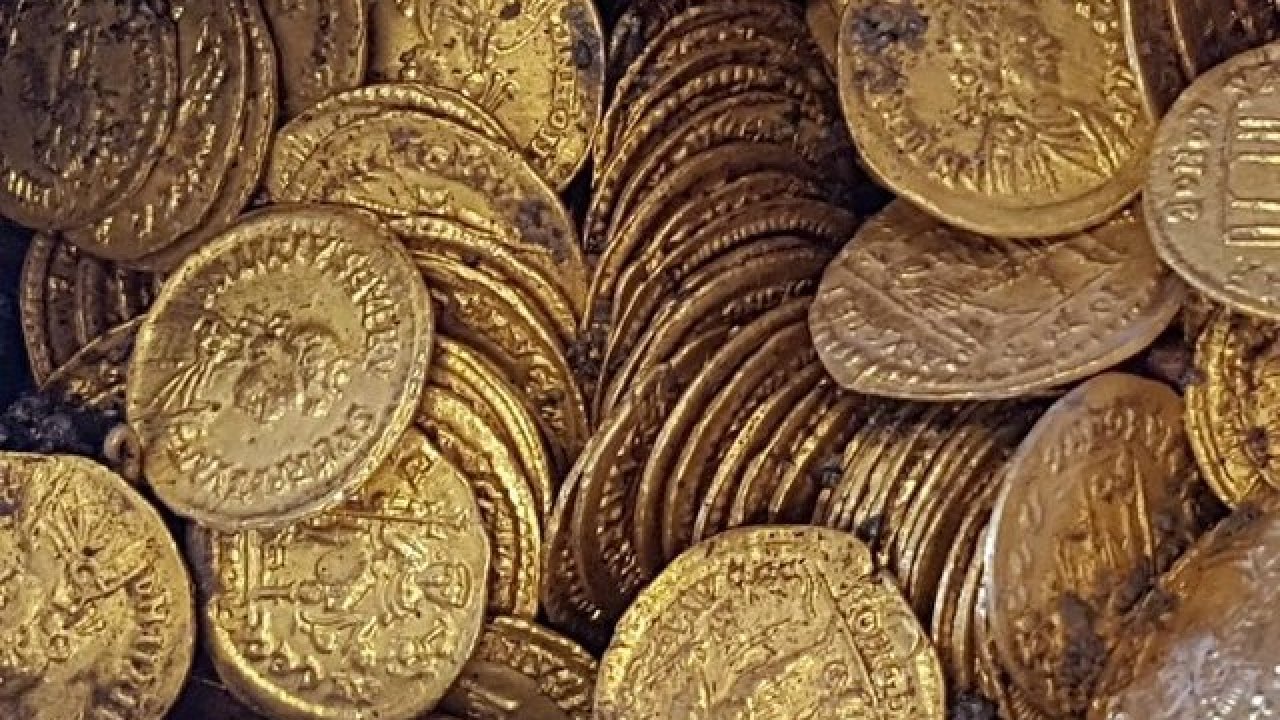
Our forefathers traded products for gold and remnants of these trends still exist today.  In some nations, gold is used in making coins (though in small amount, but it is of great value.)

Invest in Gold Coins

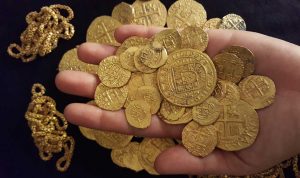
In some museums, you will find a collection of these coins that were fully or partially made of gold. The prices of gold have however faced changes in the recent years.

Today, gold is traded in electronic trading platforms.  In 2011, it managed to rise up to over $1900 before it started declining, and this shows just how much gold is still valued in society.  Gold is making headlines not only in physical form but also virtually as a basis for many cryptocurrencies.

History of gold prices in the United States

Starting in the year 1791, the prices of gold in the U.S experienced changes. In this year, the price of gold was $19.49 per ounce. 43 years down the line, the price went up to $20.69 per ounce (increasing by just $1.20 after 43 years).

In 1928, the Federal Reserve raised its base interest rate levels, which ended in a recession in 1929. These events inspired many people to redeem the normal currency and exchange fiat into gold.  This is largely why gold has more value compared to the U.S. dollar at this time.

Invest in Gold Coins

Due to the high demand for gold, the Federal Reserve was asked to raise the interest rates. In 1931 the value of the dollar increased and there was a decrease in demand for gold. In 1933, a law was stated that did not allow anyone to own bullion and gold coins

Ever since then, the history of gold prices in the U.S became more interesting for bullish investors. The strength and weakness of the dollar has contributed to the increasingy bullish price changes for gold.  Before investing in gold, you should be aware of factors that contribute in change of price in gold.

Our analysts will enable you know the best time to invest and when to avoid such markets.  As a result, there are many factors that have contributed to the change of price in gold over time. 

Demand and supply of physical gold

Gold has many uses from making jewelry to being used as a store for wealth. When gold is in high demand and the supply is low, the prices tend to go up. This is one cause of changes in gold prices. It is not different from the other markets.

Any product that has low supply compared to demand increases in price. When gold is in high supply and the demand is low, prices go down. This is because sellers has more than what the market needs. 

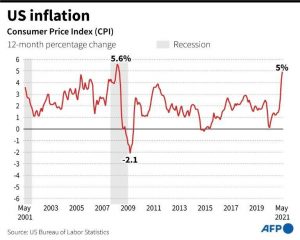
Inflation and deflation

This is a sign that the economy is growing. Higher rate of inflation leads to higher prices of gold. Inflation is as a result of stable political factors and motivation in economic growth.

For instance, gold did not perform well during the world war. Before the beginning of World War 1, some nations adopted the Gold Standard, which was used to compare domestic currencies (before setting the prices) to the value of a certain amount of gold.

U.S. Inflation

However, this came to an end when the war begun. During this period, economic growth was not experienced either. Deflation happens when there is no upward growth in the economy. It is a time when there is less employment opportunities and investments. This leads to decrease in gold prices.

Central banks

Central banks are in charge of the amount of money circulating in a country. It also has the mandate to limit the amount of gold in supply. This can lead to change in prices.

Another factor to remember is that when the central bank increases interest rates, the price of gold rises. Central banks therefore play a vital role in changes of gold prices.

Strength and weakness of the U.S. dollar

These days, Gold is denominated in U.S. dollars. When the value of the dollar goes high, the price of gold decreases. It is also true that gold price increases with a weakening dollar value.

U.S. Dollar

Of course, this is because when the dollar becomes weak, the currency in other nations become stronger. When this happens, the demand for products go up, gold is one of them. Its demand goes high leading to raise in its price. 

Conclusion: gold’s long history in financial markets

The history of gold prices starts way back during the B.C era. It was highly valued like today. As time went by, gold coins were used instead of gold bars. Today, gold remains to be a treasure.

If you have gold, you feel that you are rich. This is because of the value it has and how much it is worth. A small piece of gold will go for dollars. Most importantly, people in the buying and selling of gold should not overlook its journey.

Precious Metals: Gold Is Basing For Next Bullish Wave

Precious Metals: Gold Is Basing For Next Bullish Wave

In 2019, one of the market’s most surprising stories has been the massive bull trend movement that has been established in gold.  Additionally, a series of unpredictable changes occurred in the realm of monetary policy, as the Federal Reserve has already broken with its long-standing position to raise interest rates as a way of preempting continued expectations for growth.  In the U.S., the latest evidence in the national GDP readings implies growth rates that are close to zero for the fourth quarter. Overall, this is not a bullish scenario for stocks —even with the S&P 500 trading near its record highs. 

My regular readers know that I often tend to look at market inflow activity in some of the precious metals industry’s most popular exchange-traded funds (ETFs).  This would also include instruments like the VanEck Gold Miner’s ETF, which is a topic I have discussed in a prior article.  Ultimately, this type of approach to baseline fundamental analysis can provide important clues that help identify price trends that are likely to begin reversing relatively soon.  

Most directly, we can see that recent activity in the SPDR Gold Trust ETF (NYSE: GLD) has shown outflows worth $1,308.7 million over the last four weeks.  However, this figure might paint a very different picture when compared to various time horizons. In the last 13 weeks, GLD has seen inflows of $2,330.9 million but this figure actually grows to $7,191.3 million over the past 26 weeks.  Overall, these are significant differences that give us a fundamental reason to believe that there will be underlying strength in any technical trading events that are generated as a result of 2019’s bullish trend moves.

Gold GLD

Traders should define the major rallies in precious metals as a development the occurred after the beginning of summer.  However, the true origins of that really actually began much earlier (as commodities markets were confirming their lows near the end of 2017).  In this chart, I have outlined a series of levels that could prove to be pivotal in the event we see a true bearish reversal in the price of precious metals.  

Using the price valuations in GLD, we can isolate these important price levels as falling near $106.80, $112.05, and $126.50.  This first level marks the lows from December 2016 while the second level marks the lows from August and September 2018. The third level on the GLD price chart shown above is meant to mark the highs from February 2019.  This final price zone will now be expected to act as support once the GLD valuation overcame resistance at these levels.

Gold GLD

Shorter-term, the confluence of these technical factors suggest we are likely to begin basing above the $126.50 region.  Evidence supporting the bearish outlook would include the slowing momentum levels that are present on the daily charts. In my own trading, I will be paying special attention to the technical indicator readings in the Commodity Channel Index (or CCI).  I expect to see the first clues of short-term reversal in the CCI reading. Longer-term charts (weeklies) are clearly positive and it seems to be just a matter of time before that prior uptrend resumes.  

Initial resistance levels suggest traders will likely target $147.10, which was the price high from September.  However, the price targets that could be reached if these levels are broken could be outrageous. Long-term readings in market momentum remain favorable and the short-term retracements we have seen to the downside could create some new buying opportunities in the weeks ahead.  For additional information on how I use the Commodity Channel Index to gauge price momentum, readers might be interested to see my Momentum Trading Tutorial which explains in greater depth some of the ways these technical charting tools should be interpreted.


Silver: This Under-Achiever Is Ready To Shine

Silver: This Under-Achiever Is Ready To Shine

For most of 2019, the emerging trends in the precious metals space have been undeniably strong.  Many analysist (possibly a majority of the financial analyst community) seemed to think that these types of events were impossible, given the fact that the S&P 500 was on a clear course to continue posting record highs.  

However, when this type of enthusiasm in equities reaches an extreme, it’s often a good idea to start looking at the precious metals space as a protective buffer against the growing potential for downside volatility.  This was the basis for many of my bullish commentaries (and actual trades) during these periods and recent price moves have largely confirmed the accuracy of those forecasts.

If we take a long-term view of the SILVER/USD chart history (weekly), we can see that the initial surge in price activity became apparent during the May-June trading period.  The first major signal that the paradigm had shifted developed once prices forcefully broke through the Ichimoku Cloud structure. Prior to this event, the most significant price lows formed toward the end of May (just below $14.30) and SILVER/USD soon rallied by more than 37.5% to reach new highs of $19.65 in roughly five weeks.

Silver Price Chart
Silver Price Chart

For some investors (particularly those focusing on cryptocurrencies), these rallies might not seem all that significant.  However, we must consider the fact that SILVER/USD had been caught in a dramatic long-term downtrend that had produced very little upside price movement since July 2016.

If we look at this same catalyst event on the SILVER/USD daily charts, we can see that Kumo support lies within close proximity to the current market valuation.  This is another highly encouraging element for anyone bullish on assets tracking the value of silver. As long as markets can hold these levels (and not break downward through the Kumo), the implication is that SILVER/USD will be in a position to move above the September highs of $19.65.

Silver Price Chart
Silver Price Chart

Of course, all of that will depend on price performances seen in the shorter-term charts.  Interestingly, we are starting to see similar events unfold on the SILVER/USD hourly charts (and this largely supports the broader thesis).  

Silver Price Chart
Silver Price Chart

Traders that are familiar with the practice of Fractal Analysis might view these recent developments as particularly exciting, given the ways they suggest an extension of the prior bull move that generated the May-June price breakout in SILVER/USD.

Silver Price Chart
Silver Price Chart

What’s notable here is that the short-term Ichimoku Cloud break (on the hourly charts) shares many of the same features that were present during the May-June catalyst event.  On the hourly charts, there is a bit more distance present between price and the Kumo, so this actually suggests we could still see some further downside without eroding the bullish bias for SILVER/USD.

Silver Price Chart
Silver Price Chart

Furthermore, this recent break of cloud resistance on the SILVER/USD monthly charts was accompanied by an overbought surge in the Connors RSI indicator reading.  When I use the Connors RSI indicator, I will generally look for bullish/bearish divergences rather than instances of price extremity. The reason for this is that the indicator tends to send many more signals when compared to the traditional RSI reading.  

In this case, the Connors RSI projected upside price moves (based on the divergence) and this is another factor that points to an eventual re-test of the September highs.  For more information on how I interpret these specific indicator readings, I encourage readers to review my Connors RSI Trading Tutorial for a detailed explanation of how I conduct my price analysis.