KO: A Look at Coca-Cola Stock Ahead of Super Bowl

KO: A Look at Coca-Cola Stock Ahead of Super Bowl

  • Stock choices become increasingly difficult when S&P 500 is at record highs.
  • Seasons like Christmas to not spell the end of buying activity for consumer products.
  • Consumer surveys showing more bullish signs that you might think exist, when viewing valuations at Coca-Cola.

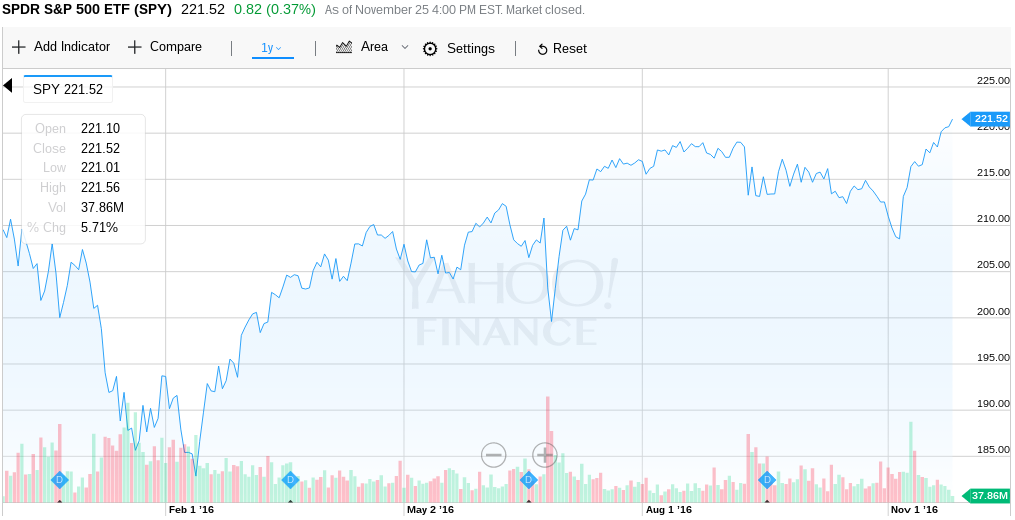
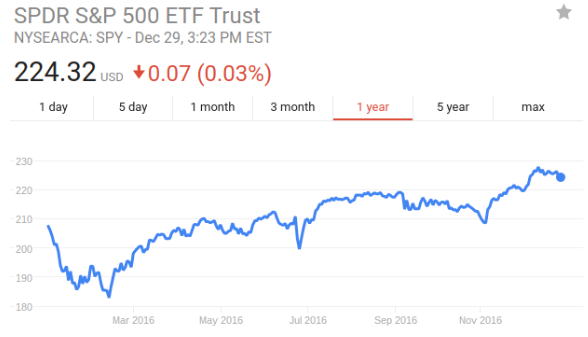
Stock markets have taken some turbulent turns over the last few months, as the post-summer doldrums have been anything but dull.  The SPDR S&P 500 ETF (NYSEARCA: SPY) and the SPDR Dow Jones Industrial Average ETF (NYSEARCA: DIA) continue to press toward all-time records and generalized optimism has been the rising tide that has lifted all ships.  Investors looking to establish positions in these assets can use the MetaTrader platform through an MT4 broker, as this is one of the most efficient means of accessing the market that is currently available.

Chart View: SPDR S&P 500 ETF (NYSEARCA: SPY)

When we make our investment analysis in these central benchmarks, investors are most interested in finding opportunities that have been missed and one of the best examples of this can be found in The Coca-Cola Co. (NYSE: KO), as broader consumer spending levels should become evident within the company over the next few months.  

While many investors are being distracted by the holiday cheer that typically accompanies the Christmas season, investors should be looking ahead to the next big consumer event.  This, of course, can be found in the media juggernaut that is the NFL Super Bowl, which will take place on Sunday, February 5th.

Chart View: University of Michigan Consumer Survey

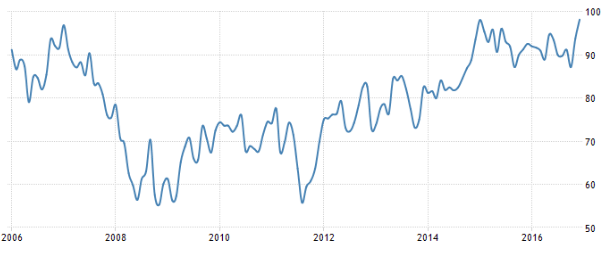
When we are assessing the market reaction to these types of events, it is important to understand the macro foundations that go into determining whether or not consumer spending is likely to change in material terms.  One of the best ways of doing this is to assess activity in the University of Michigan Consumer Survey, which has now risen to 98.2 and the highest level in almost 15 years.  

Now, the importance of these types of trends can be argued from multiple directions.  But the reality is that we are seeing a material shift in the ways American consumers are likely to approach their everyday purchases.  In pure searches on the internet, terms like NFL Playoffs and Super Bowl consistently come in near the top of the list and it is important to understand that this is more of a seasonal event that it is a one-time viewing opportunity for advertisers.  

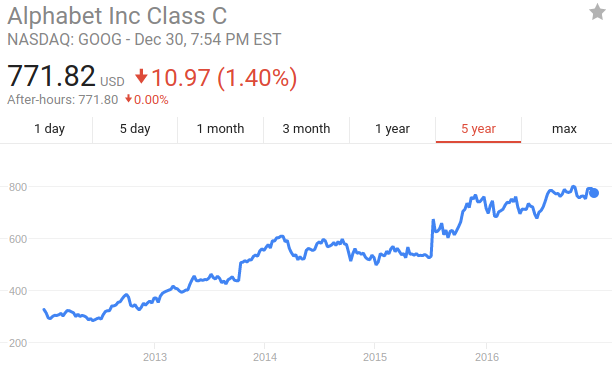
Chart View: Coca-Cola Co. (NYSE: KO)

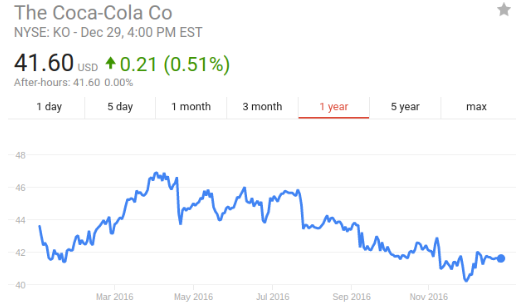
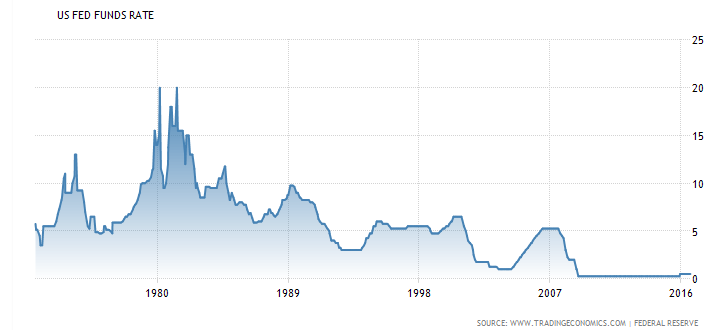
The company is commonly thought of as a perennial favorite of leading Berkshire Hathaway (NYSE: BKR.A) mind Warren Buffet, which in part is due to the KO’s handsome dividend yield (which currently stands at 3.36%).  This is a massive yield given the fact that we are still in a low-interest rate environment and in a weak state as far as GDP production is concerned.  

Stock Market Outlook

This means that investors are paid to wait for stock markets to realign themselves in ways that should favor consumer stocks like KO.  On the broadest level, it should be remembered that stock choices become increasingly difficult when the S&P 500 is at record highs.  In cases like this, it is essential to take a long-term view and identify the potential for growth before it happens.  

Seasons like Christmas do not spell the end of buying activity for consumer products, as some of the biggest consumer audience events happen in the months that follow.  All of this points to bullish signs that you might see when viewing valuations at KO, the stock could rally over the next few months.

Will S&P 500 Hit New Record Highs?

Will S&P 500 Hit New Record Highs?

The S&P 500 is arguably the most important benchmark in the financial markets.  Over the last few months, we have seen some amazing trends that have confirmed a bullish end to 2016.  But now that a lot of the initial optimism in stock markets has fully run its course, investors will be looking for new ways of profiting on a dynamic market that has been defined by bullish sentiment and low interest rates.

For the S&P 500, this has meant new record highs at a fairly regular clip, as investors start to price in the possibility of renewed economic optimism under the administration of President Donald Trump.  When trading this type of event in the market, traders can use the SPDR S&P 500 ETF (NYSEARCA:SPY), which can be traded using the MT4 platform that is made available by easyMarkets.

Stock Market Trends

When looking to make the best investments in the S&P 500, it is essential to understand the cyclical nature of the ways that stock market trends unfold.  If, for example, we were to look at the Elliott Wave Theory, then many would suggest that the markets unfold in a series of wave structures that can be forecasted in advance.  

On the other hand, practitioners of fundamental analysis will need to look at factors like price-to-earnings ratios and industry competition in order to determine which stock investment strategy is best.  So there does not necessarily need to be a one-size-fits-all strategy when looking to gain stock investment exposure in assets that are tied to the S&P 500.  

The world-famous stock benchmark is currently trading at record highs and when we think about the fact that the Federal Reserve has left the economy at relatively low-interest rate levels there is still clear scope that we could see stock market rallies in the S&P 500 index.

S&P 500 Trading Systems

When we are looking at the potential trading systems that can be used to trade the S&P 500, it is important to consider possibilities like options and contrarian strategies that are able to take advantage of stalling momentum or even complete reversals in major benchmarks like the S&P 500.  This is not always something that is considered by traditional stock market investors, but this is an investment strategy that can be used to profit from investments in the other direction when stock markets are trading near their all-time highs.  

Stock Price Chart: GOOG

In other cases, it makes sense to look at other stock market benchmarks like the Dow Jones Industrials and the NASDAQ.  These instruments have their own characteristics when we are looking at the ways stock market investors can implement a stance on the economic outlook.  But now that we have seen some more evidence with respect to the ways the Federal Reserve will probably proceed with interest rate policy over the next two quarters, there are ways for investors to capitalize on these trends as they unfold.  

How to Invest in the S&P 500

How to Invest in the S&P 500

When we look at the financial markets activity that is currently seen today, there have been some interesting trends that have started to unfold.  Since the Great Recession of 2008, financial markets have started to stabilize and this has led to historic bull rallies in assets like the S&P 500.  For newer investors, it might be unclear what this stock benchmark is exactly.  So, here we will look at some of the factors that are traditionally involved when investors are ready to start investing in the S&P 500 stock market index.

S&P 500: The Basics

First, it should be clear that the S&P 500 is a collection of 500 commonly traded companies that are offered in shares on a US stock exchange.  When we look at the financial news headlines in periodicals like the New York Times or the Wall Street Journal the numbers that are quotes will essentially tell you the collective value of those 500 commonly traded stocks.  So, for example if the television news tells us that the S&P closed at 2,000 on a given day it would essentially mean that the total value of all stocks in the index would be equal to $2,000.

screenshot-2016-11-26-at-9-36-23-pm

This is important for those investors that are looking to buy the S&P 500 stock index as a whole.  This can be done using a few different methods.  Investors can buy stock options or stock futures as a means for speculating on the underlying value of the stock exchange.  This can be accomplished using the MT4 trading platform that is freely available from easyMarkets.  Additionally, investors can buy into exchange traded funds (ETFs) that track the total performance of the S&P 500 index.  The most common instrument for doing this would be the SPDR S&P 500 ETF (SPY), which is one of the most commonly traded assets in the financial markets.

Individual Stock Shares

Whenever you are trading in the S&P 500 it is important to remember that you are still trading the values of individual stocks.  In the general consumer space, this includes names like Exxon Mobile (XOM), Johnson & Johnson (JNJ), and General Electric (GE).  In the tech space, there are other popular names that can often influence the market.  This includes some of the best stocks in the market:  Apple, Inc. (AAPL), Microsoft (MSFT), and Facebook (FB).  

So, if you are looking to get started in investing and to learn how to profit in the financial markets one of the best options that will be available to you can be found in the asset instrument known as the S&P 500.  Significant profits can be made, but when you are dealing with the pro stock markets it is always best to conduct your proper research before getting into any major investments that could be subject to increased market volatility.  Once this is accomplished, it becomes much easier to beat the market and to secure your financial freedom for both wealth-building and retirement.  Good luck to you in your stock market trading!

Dividend Stocks: JNJ Looks Strong After Earnings

Dividend Stocks: Johnson & Johnson Looks Strong After Earnings

  • Bullish run in JNJ set to continue, despite claims stock is overvalued
  • Overall, margins and earnings performance will support the stock into next year
  • Wait for small retracements to improve risk-to-reward outlook

Johnson & Johnson (NYSE:JNJ) is a company that has one of the most firmly-established presences of any name that can be located in the financial markets.  The company was founded in 1887 by Robert Wood Johnson, James Wood Johnson and Edward Mead Johnson with its headquarters in New Brunswick, NJ.  Today, Johnson & Johnson is, ultimately, a holdings company.  Their main businesses are in health care products and its manufacture and sale of a wide range of products that are sold in almost every American household.

In the healthcare field, the company has been a forerunner in the research and development of everyday products that have become staples in defining modern daily life.  The company, through its subsidiaries, does business around the world in 120 manufacturing facilities and can be traded using the MT4 platform.

Johnson & Johnson’s Redefined Expansion

With this context in mind, it should be understood that there is still room for expansion at the company — and Johnson & Johnson has taken recent steps to define this as an emerging outlook.  Last month, the company announced its plans to buy Abbott Medical Optics for $4.325 billion in cash. In a similar move last quarter, the company acquired Vogue International for $3.3 billion in cash as a means to strengthen its position in hair care and other personal care products.  From a strategy perspective, it can be said that these efforts have come in response to recent disappointments in its quarterly earnings reports.

On July 19, the company announced Q2 results, with earnings-per-share of $1.43 and Q2 sales of $18.5 billion.  Prior to this, the analyst consensus showed expectations of earning-per-share at $1.68 and sales of $17.97 billion. On the positive side, JNJ’s Q2 worldwide sales increased by 7.9% while domestic sales grew by 8.8%. Thomson Reuters polls suggest that FY2016 sales will come in from $71.5 billion to $72.2 billion and adjusted earnings-per-share will come in from $6.63 to $6.73.

Stock Performance

Johnson & Johnson stock is currently trading near $117, toward the upper end of its 52-week trading range of $94-126, with a trailing twelve-month earnings-per-share is $5.37.  At these valuations, this gives JNJ a 21.9 PE — and this is perhaps one of the most overlooked features of the stock at current price levels. The industry average shows a PE multiple of 36.6.  So when we take these factors into consideration along with the significant buy momentum that has already been seen this year, it is much easier to see why the current bull run has not yet run its course.  At this stage, the analyst majority is expecting earnings-per-share of $6.96 for the year ending December 2016 and $7.11 for December 2017, and this supports the outlook for further gains in the market valuation.

Over the last five years, Johnson & Johnson has produced a 13.32% annualized return-on-investment, and a 20.05% annualized return-on-equity during the same period.  On the negative side, it should be noted that the company has a somewhat subdued 5-year annualized sales growth rate of 2.62% and 5-year annualized EPS growth rate of 2.76. This can be attributed largely to the broader weakness we have seen in global markets, and this is something that should continue to be rectified as long as most central banks in emerging markets maintain a dovish policy stance.  Another factor that helps to reduce these negatives is the fact that the company performs much better with its margin levels than the comparable industry average.  Its gross margin is TTM 69.61% vs industry average of 54.53% and its net profit margin is 21.20% where the industry average now rests at 11.10%.

Dividend Stock Investing

So while many analysts have dismissed the stock as being overvalued in the current market context, there are several factors that put those forecasts at risk in favor of additional runs higher.  Given the regular nature of the stock’s price performance over the last year, investors can wait for a drop back toward the 200-day moving average near $115 (highlighted in the chart above).  One factor that could change the outlook and reduce performance within the company is the fact that Johnson & Johnson is still lagging when we talk about the company’s return-on-assets. Its 5-year average annualized return-on-assets is 10.66% (compared to the industry average of 13.25%), so there are clearly managerial issues here that will need to be addressed.  Similar trends have been seen in cryptocurrency markets and this is likely to continue until investors see a Bitcoin ETF.

But, overall, investors will continue to be rewarded for their patience in the stock as the company is one of the best regular dividend payers in the market. JNJ pays its dividend quarterly, and over the last two-quarters the company paid $0.80 a share (a dividend-yielding 2.7% at current prices). This is nearly double the industry average, which is now showing yields of 1.41%, and this is why there are still many in the analyst community expecting the stock to outperform when bought on dips from current levels.

Will The Fed Stall Stock Markets?


Will The Fed Stall Stock Markets?

The US Federal Reserve is a regional bank that is the central banking system of the United States. Operated by the Federal Open Market Committee the bank is responsible for implementing monetary policies as well as controlling the economy of the country. The US dollar is the prevailing currency of the USA, and this can be traded using the forex trader platforms offered by easy market.

Since the financial crisis that hit the country in 2008, the Federal Reserve has held on to keeping the interest rates as low as possible for more than seven years in order to help recover the economic state of the country. As much as this move is positive, some economists claim that it is setting up competitive pressure that is increasing credit risk, weighing on bank returns and pushing money lenders to compete for more for borrowers.

Monetary Policy:  The End of QE

However, the most recent time when the US central bank raised its interest rates was back in December promising to raise the rate about four more times in the years 2016. Later on, the bank reported that it would only raise the rates twice in the year. The bank explains that it is safer to proceed moderately considering the prevailing economic risk in order to verify the strength of the labor market.

Furthermore, in a statement released after a two-day meeting in March this year, the chair of the Federal Reserve put forward that the central bank had put on hold a further increase in the interest in the US. This came as the opposite of what the majority was expecting. Most people expected that an announcement regarding an increase in interest rates.

Historic Interest Rate Levels

screenshot-2016-09-10-at-4-18-00-pm

The Federal Reserve resolved to keep the rates between 0.5% and 0.25%. For this, it claimed that though the labor market is strengthening, it still targets reaching a 2% inflation rate which will see the US economy expanding moderately. This comes after a recent decline in energy prices globally and a low inflation rate internationally.

Most economists expected the chair Janet Yellen to hint at the two interest rates hikes that were promised earlier down from the four previous ones that were revoked. Probably, the hike has been postponed following the slowdown in China or global market uncertainties and with the next meeting of the Federal Open Market Committee scheduled on June 14-15, it is expected that there may be a hike in the rates.


A Brief Introduction to Gold & Silver Mining Stocks


A Brief Introduction to Gold & Silver Mining Stocks

Gold and silver mining stocks are extremely popular, and over the last decade, some of them have made investors millions. It’s important to understand what you’re getting into when you buy mining stocks, however, because some people mistakenly believe that they are buying ownership of physical metals.  Of course, most precious metals experts generally recommend that conservative investors buy gold coins as a means for gaining access to the physical markets.  It is also important to have an understanding of gold and silver mining stocks as this can be a good indicator of where physical gold prices will travel in the future.

What are gold and silver mining stocks?

Gold and silver mining stocks are shares of publicly-traded mining companies. These stocks usually represent an entire company, although it is possible to buy shares of specific mines. Gold and silver mining stocks do not represent real gold or silver, just as owning Coca-Cola stock doesn’t entitle you to grab a free Coke whenever you feel like it.

How do you buy and sell gold and silver mining stocks?

Gold and silver mining stocks trade the same way other stocks trade – you can find “miners” on the Dow, NASDAQ and S&P markets. You can use a stockbroker to trade mining stocks or you can opt to have a go at it on your own by using online stock trading platforms like Scottrade or E-TRADE.

What causes fluctuation of mining stock prices?

Gold and silver mining stocks’ prices fluctuate based very little on the actual spot value of gold. If anything, mining stocks can themselves have an effect on precious metal prices because successful mines could translate into a higher supply and low prices.

Screenshot 2016-08-26 at 12.49.55 AM

Chart Source:  Atlanta Gold & Coin

The opposite effect can also be true – if mines under-produce then a perceived gold shortage could cause prices to skyrocket. Gold and silver mining stocks also experience fluctuation based on how the company is run (as is the case with any publicly-traded company). Lastly, changing government protocols (such as new regulations, coups, takeovers, mine nationalization, etc.) can affect the price of gold and silver mining stocks.

Conclusion

We hope this tutorial has been helpful in growing your understanding of gold and silver mining stocks. You’ll need to do a lot more research before you’re fully prepared to make a mining stock investment, and we hope this article has provided you with a good foundation on which you can increase your knowledge, thus giving yourself a better chance of making a successful investment.

Best Dividend Stocks: A Look at Walmart and Wells Fargo


Strong Cash Generation Makes Wells Fargo and Wall-Mart a Safe Stock for Dividend Investors  

Wells Fargo & Co. (WFC) is a diversified financial services company. The company is always considered as a safe haven for retirees and defensive investors, amid its long dividend history and strategy of returning a significant portion of cash to investors. According to figures from Correct Trade stockmarket reports, Wells Fargo currently offers a quarterly dividend of $0.38 per share, yielding around 3.11%.  

In the last five years alone, it has increased its dividends by 50%. Wells Fargo has been increasing its dividends at almost double digit rates since 2008. The company’s sustainable growth in revenues, earnings, and cash flows are the key drivers behind its success and dividend growth.

WFC: 3-Year Performance

In the last three years, it has expanded its revenue base from $83 billion to $86 billion. WFC is now expecting its revenue to stand above $87B by the end of this year. On the other hand, its earnings growth is standing around 7% in the last three year.

The company has substantial potential to generate increasing cash flows. In addition, it is operating in a less-capital intensive industry, which provides further room to pay increasing returns to investors.

Consumer Spending at Walmart

On the other hand, Wall-Mart (WMT) is the largest departmental store by market capitalization of $225 billion. At present, Wall Mart offers a quarterly dividend of $0.50 per share, yielding around 2.74%. Wall-Mart is a dividend aristocrat, as it had increased its dividend over the last 43 consecutive years.

Wal-Mart’s extensive footprint and penetration in end market along with strong brand recognition allow it to generate a sustainable growth in financial performance, which further allows it to pay increasing dividends. The company’s dividends are completely safe on the back of strong cash generation potential.

Quarterly Results

In the latest quarter, the company generated free cash flows of $6.3 billion, when its dividend payments accounted for only $1.5 billion. The huge gap in free cash flows and dividend payments clearly shows that the company’s cash generation potential is offering a huge for a further dividend increase.

Both, Wall-Mart and Wells Fargo are safe picks for dividend investors, amid their cash generation and extensive business structures. Buying and holding these stocks for increasing dividends and steady share price appreciation is a good strategy.  


Dow Jones Investors: Technical Analysis Strategies in Daytrading


Dow Jones Investors:  Technical Analysis Strategies in Daytrading

The price-weighted average of the most 30 prominent stocks traded on the New York Stock Exchange (NYSE) and NASDAQ is known as Dow Jones. In general, the stocks with higher market caps are considered in Dow Jones trading and this is important information when we are looking for ways to capitalize on stocks in live markets.  

Dow Jones Daily Bar Chart

Capture

Figure: Dow Jones Technical analysis strategy

Trading the Dow Jones is pretty effective with RSI and 200-day moving average. Forex moving averages can be found using an effective forex trading platform like the software offered by easyMarkets.  Traders draw trend line and channel to find potential trade setup. Unlike another trading strategy Dow Jones is traded with breakout strategy. Traders draw proper channel and trend line in the daily bar chart and wait for confirmation signal in the RSI after the breakout.

Trading Channel Support

In the above figure sell signal was initiated with the breach of channel support. Traders take the confirmation from RSI value. Since a value of RSI was below 50, the sell signal was valid.

The second trade was initiated after successful completion of the triple bottom in the bar chart. Traders went long after the new higher High which was created just above the 200-day moving average. Before going long, make sure that the value of RSI is above 50.Remember that we will go long only if the price is above 200-day moving average and for short the price should be below the 200 days moving average.

Understanding Time Frames

When you are using technical analysis strategies like this, it is always important to consider the time frame you are using in your approach.  There are some differences in the ways that markets operate in the short-term and long-term perspectives, and these time frames tend to be most useful for certain types of trading styles.  If you tend to have a more conservative approach, then it is usually preferable to adopt a long-term trading strategy as this will allow you to avoid many of the short-term fluctuations in price that can be seen on a short-term day trading basis.  These are factors that should be considered before you make the decision to put live funds into the active markets.

What is a Chart Pattern?


When we are looking to make definitions as a concept, a chart pattern is a systematic up and down price structure which helps us to understand the basis scenario for technical analysis. For any technical analysis, the chart pattern changes according to time and environment. One can focus on this analysis by keeping the track of his chart patterns, as this will be helpful in real-time trading opportunities.  These are some of the patterns that are used be expert traders in PAMM trading accounts, so this is useful for forex traders of all experience levels.

There are several types of chart pattern which are as follows

1) Ascending triangles: – The continuous upward trend of the graph is often called an ascending triangle.

2) Descending triangles: – As from the word descending, any pattern which is downgraded so the graph is a reverse of an ascending is called descending triangle in term of technical analysis.

3) Head and Shoulders: – Head and Shoulders chart patterns can be defined as when a pattern which is in an upward trend and declines but again rises above the last peak and declines again. It is a popular chart pattern for long-term traders.

4) Pennant: – A continuation pattern in technical analysis which sees the rise in graph followed by consolidation period is called pennant. It generally happens due to large movement of stocks

5) Cup and Handle:  A pattern which resembles in the shape of a cup with a handle.

6) Systematic triangles: – A period of consolidation in terms of price movement is called systematic triangles

7) Double Top: – Double top simple means that a pattern in which a peak is touched and declines but rises again almost of the same height.

8) Rounding Bottom: – A ‘U’ Shaped pattern of the technical analysis series of price movement is called rounding bottom.

In present day life, the most reliable chart patterns are the graphical methods which make it easy to understand how trends will develop. The pattern helps to identify the trend. The formation of the pattern is made up of daily activities recorded by different tools.

What is Small A Cap Stock?

What is A Small Cap Stock?

To understand this term, we first have to know about the market capitalization of a company. In the Market, the total value of the outstanding shares of a company is called market capitalization.  In simple terms, total money available to the company on hand. The formula for calculating the market capitalization is multiplying the stock price by the complete number of outstanding shares.

For instance, if 20 million shares of stocks have been issued by a company with the current price of that stock $2 per share, then the market capitalization also abbreviated as Market Cap, of the company would be 40 million. Small Cap, as the name itself, suggests “stocks of a small company” that has the market cap under $2 billion.

In the stock market, the size of a company is not measured by the number of employees it embraces, but rather is decided by the total market value that company holds. Most people automatically assume that small cap companies always holds low stock value than what large cap companies holds. Similarly, nor all firms that have high stock values are always the large cap firms.

Why Small Cap Stocks are Not Considered Good in the Market?

  • Generally, they involve a higher risk of loss of the money that you have invested in it. Investors always think 100 times prior investing in the small cap stocks due to their small size that can come up with possible market fluctuations.
  • Stock prices are uncertain of course. They can go up or fall dramatically at any time as a result of a number of reasons like economic crisis or bankruptcy etc.

Advantages of Small Cap Stocks

Despite the disadvantages of small cap stocks, there is a flip side. There are also some positive factors that may lead investors to think twice over the investment plan in small cap stocks.

  • Investing in Small-Cap Stocks can sometimes turn into great potential of earning better profits in many ways than the big companies that invested in the Large Cap Stock.
  • Less Visibility in the Media: As smaller companies are likely to invest in Small-cap Stocks, they don’t get the enough media coverage and visibility. Some well-informed investors make the better use of this media coverage absence and take the benefits of best and attractive valuations which is often get neglected by broader market.

Trading Stocks with the Pros