One of the most important factors in gauging the stock market is Dow Jones Average; this index was established by a great publishing company that is still trusted by many investors.
Investors can measure the stock movements using this index and it is a trustworthy indicator of potential trends in both stocks and bonds. If you are interested to know more about it, this article is for you!
Introduction: A Brief History
The history of the Dow Jones Industrial Average all goes back to the end of the 1800s. A time the stock market was reaching the public interest. Considering that no TV or internet was available to the people back then, it should be easy to see that Charles Henry Dow and Edward D. Jones came up with a great idea in publishing stock news for the masses.
This financial news publisher was a daily magazine that published the news of 1 major stock back then. They created a chart of 12 houses of these 12 companies. As time went ahead, Dow Jones stock Averages added more and more companies in their charts; they indicate stock substitution, correlated changes and other factors based on divisor.
These Average signs facts are to show the Average prices of each stock on a daily basis. Dow Jones Industrial Average or DJIA is now based on 30 different stocks on an industrial basis. There are other stocks, they cover as well; Dow Jones transportation stocks, Utility Composite and several; bod Averages along with that. Here is a total list of Dow Jones Average magazine covers;
- Dow Jones Industrial Average or DJIA- stock of 30 companies in total
- Dow Jones Transportation Average or DJTA- stock of 20 transportation companies in total
- Dow Jones Utility Average or DJUA- stocks of 15 Utility companies in total
- Dow Jones Composite Average or DJIA- this Average considered the total composite of DJAI DJTA DJUA put together
- Bond Shares
This magazine is the leading stock magazine for decades for an investor who we trying to measure their markets. Although other popular scales of the stock market in American Securities Market are: the S&P 500 Index and the Russel 2000 Index.
As one of the area’s most favored stock advisors, this publishing service has done great services for investing public. The most interesting aspect was that this magazine was a market analyst journalist rather than investors.
When this magazine started to publish, it was the blooming years of the stock market. Some even believe it was the effect of Dow Jones Average journal that led to much great marketing minds to jump-start their activity.
As the economy grew, many companies added to the stock market Average. However, from there, is only one local company that has been a part of Dow Jones’s Average magazine from the beginning; this magazine was named General Electric that has seen more than a century together with Dow Jones Average publisher.
Annual Dow Jones Average Trends
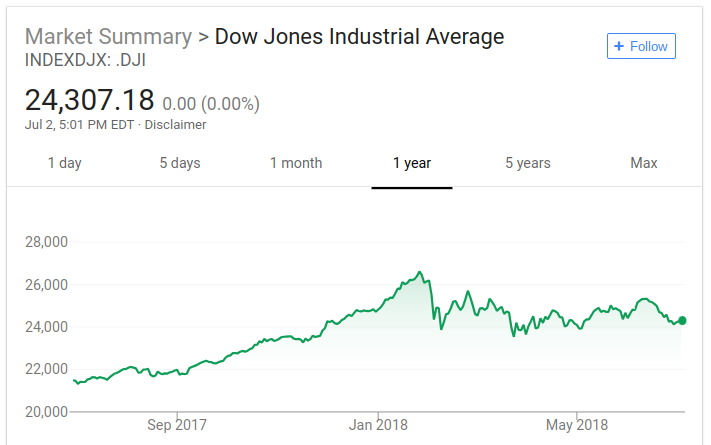
This magazine has always stood proud in the hallmarks of stock history. Although experts mark the 2008 financial crisis that was a widespread low time for many, it also affected Dow Jones’s Average publishing.
This hallmarks are concentrated on a market’s doomsday; 29th of September in the year 2008. Dow Jones Average loss was to a point that was recorded in the whole history of the stock market.
It was technically the third-ranking the history of stock loss registration. On the contrary, the golden year for stock ranking registration was the year 1915; a value increase of 81.66 increase.
Mutual funds in Dow Jones Average Publishing
If you are fascinated by the magnificence stock sharing company. you can invest it. The easiest way to get in the game with Dow Jones Average is to make an indirect investment; you can invest by buying index fund shares.
However, any of the index funds such as mutual funds and exchange-traded funds are replicable. That means they can replicate before fees and expenses; by holding similar stocks in the exact same proportions.
Downfalls and setback of Dow Jones Average magazine
Some expert believes that Dow Jones Average offers an inaccurate representation of overall market performance. According to Eric Edelman, one of the greatest and most accurate stock critics, S&P 500 and Russ3l 300 indexes are much more accurate when it comes to stock predictions.
Some other critics have pinpointed to price based criteria of their index; they claim that Dow Jones Average magazine gives a higher price to some stocks; these stocks are usually are given a higher influence to compare to their cheaper counterparts.
This is for their lack of comprehension of the stock’s price relativity to a particular company’s size and market capitalization. This way of calculation affects the price of the stock percentage. It results in showing a company’s stock market a lot weaker in the size is much smaller.
The same counter effect causes the large stocks to decide for Dow Jones Average magazine total index; that is the reason many smaller companies have been unhappy with the relevant results. For instance, being and UnitedHealth Group have the largest stock on Dow Jones Average’s Index.
The method of their calculation makes these two giant shareholders the most influential factor over the index data of this publishing.
Conclusion
Dow Jones Average magazine is one of the leading and oldest magazines in the stock market. While there are many who subject to this magazine’s function, others have been their loyal customers. As it goes for every system, there are advantages and disadvantages in any given system; and Dow Jones Average is not exempt from this fact.
Recently there has been a study conducted on the correlation facts in Dow Jones Average publishing data. This comparison has taken place between index movements. The result has revealed that these correlation compounds are higher at the time of the market including cycle; similarly, when there is a flat effect in the market, this correlation rises.