Commodities Markets: What Causes Changes in Gold Prices?
Why do investors want to know about the history of gold prices? When buying and selling precious metals, investors always need to know about the dominant market trend. Knowing about the history of gold prices will help you make good decisions. Not only in minerals but other markets, as well. It is important to know more about the history of your business. It sheds light on what you should do and when. In gold, you will know why the prices change the way they changed. You also know about the high and the low season. Gold is seen as the most precious metal among the others. Its value is mostly higher than the others. Gold, until today, is used as a store for wealth. This will continue to be the case because of the changing values of fiat and paper currencies.
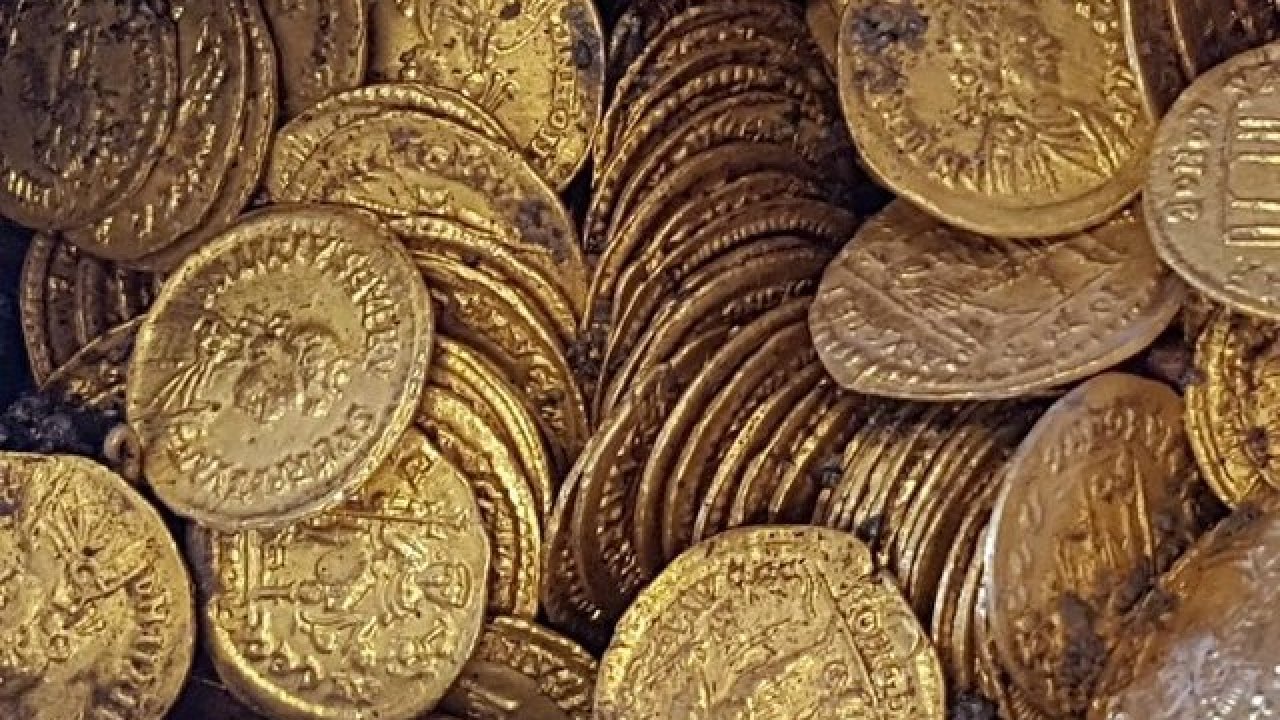
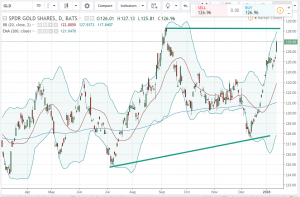
Gold prices change but they still remain at a reasonable point. Therefore, gold is the best measure of wealth. This is a continuation of the traditional norms. Kings and queens stored their wealth in the form of gold. Many decades ago, gold was used as money. Our forefathers traded products for gold. Today, all that has not been eliminated. In some nations, gold is used in making coins. Though, in a small amount, gold is of great value. In some museums, you will find a collection of these coins that were fully or partially made of gold. The prices of gold have however faced changes in recent years. Today, gold is traded in electronic trading platforms. In 2011, it managed to rise up to over $1,900 before it started going down. This is to show you how much gold is valued. It is making headlines not only in physical form but also virtually.
History of Gold Prices in the U.S
Starting from the year 1791, the prices of gold in the U.S experienced changes. In 1791, the price of gold was $19.49 per ounce. 43 years down the line, the price went up to $20.69 per ounce. Increasing with $1.2 only after 43 years doesn’t seem right. In 1928, the Federal Reserve increased interest rates. This led to a recession in 1929. This made people redeem the normal currency into gold. Gold had more value compared to the dollar at this time. Due to the high demand for gold, the Federal Reserve was asked to raise the interest rates.
In 1931, the value of the dollar increased and there was a decrease in demand for gold. In 1933, a law was stated that did not allow anyone to own bullion and gold coins. The gold was sold to Federal Reserve since private ownership was now illegal. Ever since the history of gold prices in the U.S became more interesting. The strength and weakness of the dollar have contributed to the price changes for gold. In 2011, the price of gold was at $1,895 per ounce. This was a result of the debt crisis.
Before investing in gold, you should be aware of factors that contribute to the change in price in gold. They will enable you to know the best time to invest and when not to. There are many factors that have contributed to these changes and some of them are;
Demand and Supply of Physical Gold
Gold has many uses from making jewelry to being used as a store for wealth. When gold is in high demand and the supply is low, the prices tend to go up. This is one cause of changes in gold prices. It is not different from other markets. Any product that has a low supply compared to demand increases in price. When gold is in high supply and the demand is low, prices go down. This is because sellers have more than what the market needs.
Inflation and Deflation
This is a sign that the economy is growing. A higher rate of inflation leads to higher prices of gold. Inflation is a result of stable political factors and motivation in economic growth. For instance, gold did not perform well during the world war. Before the beginning of World War 1, some nations adopted the gold standard. The gold standard was used to compare domestic currencies before setting the prices, to the value of a certain amount of gold. However, this came to an end when the war began. During this period, economic growth was not experienced either. Deflation happens when there is no upward growth in the economy. It is a time when there are fewer employment opportunities and investments. This leads to a decrease in gold prices.
Central Banks
Central banks are in charge of the amount of money circulating in a country. It also has a mandate to limit the amount of gold in supply. This can lead to a change in prices. Another thing is, when the central bank increases interest rates, the price of gold rises. Central banks, therefore, play a vital role in changes in gold prices.
Strength and Weakness in the U.S. Dollar
Gold is dollar-denominated. When the value of the dollar goes high, the price of gold decreases. It is also true that gold price increases with a weakening dollar value. This is because, when the dollar becomes weak, the currency in other nations become stronger. When this happens, the demand for products go up, gold is one of them. Its demand goes high leading to a rise in its price.
Conclusion
The story of gold prices starts way back in history. However, today it remains highly valued. As time went by, gold coins were used instead of gold bars. Today, gold remains to be a treasure. If you have gold, you feel that you are rich. This is because of the value it has and how much it is worth. A small piece of gold will go for dollars. Most importantly, people in the buying and selling of gold should not overlook its journey.