
Stock Markets: Global Trade Summit Could Change Investor Sentiment
The first half of 2018 has proved to be an average year for DIA index compared to the first half of 2017. DIA is down by 2.16% (YTD), while in 2017 it was up by 7% during the same period. It has a dividend yield of 1.86% and an annualized payout of $4.52. The annualized growth in the last three years was 9.6% with a growth of 7% in 2017.
The current half of 2018 has seen its own mix of political and economic upheavals thus bringing in serious volatility in all the exchanges around the world. The events that caused headwinds were the historic meeting between President Donald Trump and President Kim Jong Un of North Korea and, the G-7 Summit.
Macro factors continue to dominate the investment news headlines, and this is unlikely to change any time soon (as long as the trade war discussions are widely covered in the financial media).
How is global trade affecting performance in 2018?
The graph of DIA has been showing substantial ups and downs in the first half of 2018 due to the impending fears of a trade war and the federal interest rate hike.
In mid-June, the stock tumbled down 1% on the wake of President Trump’s threat of imposing tariffs on $200 billion worth of Chinese products. The major stocks to be hit were Boeing (BA) and Caterpillar (CAT) which dropped by 4% each. Goldman Sachs (GS) was up by 0.9%, 3M (MMM) was up by 0.6% and Home Depot, Inc (HD) was down by 0.3%.
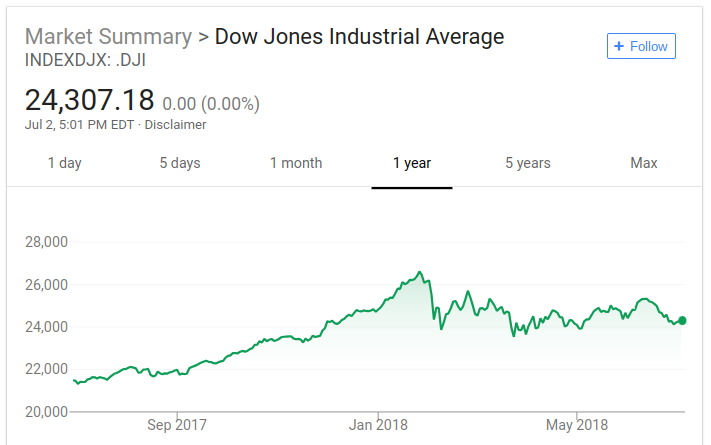
The DIA index fell down from its 50-day moving average. Compared with S&P 500, DIA has been seeing a downtrend mirroring the performance of Dow Industrials. It is a signal that DIA would thus be weaker than SPY and S&P 500. The tariffs would come in force on July 6; however, its impact on the broader exchange market is yet to be seen. In the meantime, the trade war continues between US, China, and the Eurozone markets.
Trends in stock market ETFs
DIA, like other ETF’s, showed a positive growth in June 2018 due to the recently released job data and falling unemployment rates. The greatest shock to the Dow Jones Industrials was the removal of General Electric, the longs standing and continuous member since 1907.
In the DIA, Boeing had a weight of 10% in the index, while General Electric was 0.35%. Wallgreens Boots Alliance Inc (WBA) entered as the replacement stock on June 26. The removal of GE will have a big impact on thousands of investors who have holdings in the Dow Jones.
All in all, the stock market is now in precarious territory and investors in assets like the SPDR Dow Jones Industrial Average ETF will need to remain nimble (and attentive to economic data) in the weeks and months ahead.
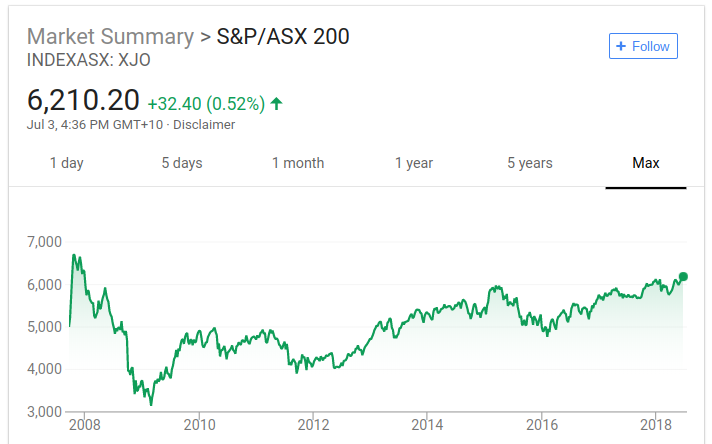
Australian equities markets
After facing considerable plunges during February and March 2018, the shares of S&P/ASX 200 showed substantial volatility during the first six months of 2018 after settling down with a YTD growth of 2.2%. The Index had shown a steady growth of 7% in October 2017 ($6,029) against the backdrop of the positivity brought by the announcement of the US tax cuts. This growth remained steady till February 2, 2018 ($6,121), when the S&P/ASX 200 fell down 4.7% in the next two days.
The Index plunged by 5% or 300 points during the period from February 2 ($6,121) – February 12 ($5,820). The stocks fell due to nasty selling by the investors due to the fear of an increase in the interest rates followed by the testimony from new Fed Chief Jerome Powell.
February 5 was the worst day for the index since June 2017 as prices fell 95 points or 1.6%. This was primarily due to the release of the US jobs data. The wage data led to panic among investors that interest rate hike was likely too. This uncertainty coupled with the inflation fears started the market rout on Wall Street which then affected other exchanges across the globe. The Australian dollar too touched an all-time two-month low.
Banking stocks
The stocks, however, rebounded back in the coming weeks by 4% after National Bank of Australia (ASX: NAB) posted an increase of 3% in the first quarter profits. Following NAB was AMP Limited which posted an increase of 24% in its revenue, while Mirvac Group and AGL Energy both posting an increase of 8% and 7% in its half-year revenue.
In March 2018, the ASX 200 dropped another 5% (February 27 – March 29) due to the US-China trade war. This heavily impacted the Wall Street and spiraled across Asia leading to a fall in the ASX 200 and All Ordinaries, with Banks and the Miners taking the biggest hit in this debacle. However, the market gained momentum in April helped by the rising commodity prices and positive growth in the Energy (+10.7%) and Materials (+7.4%) sector.
From its all-time 2018 low of $5,751 on April 3, it shot up to $6,225 on June 22, an increase of 8.35%. This was particularly due to key global events like the meeting of the President of the US and North Korea and the updates on the jobs growth in Australia and China. June 15 was termed as the best day in the ASX, as All Ordinaries saw a growth of 1.2%, while ASX 200 grew by 1.3%.